TKD Challenge Status: 招く / 303!
Just a short update on the Kanji Damage Challenge. Today I get to enjoy my second fine ale since I finished up yesterday at item number 303 a whole 65 kanji past my goal of 238.
In a way I am a bit prouder of my progress this week since my motivation has been slightly declining. I think the challenge / project has lost some of its initial novelty. I did however manage to stick with the tight program only coming short in the number of kanji per day in the weekend when trips to the zoo and purchasing of car seats took up most of my day.
I think both the nature of the challenge, the constant reminder of the prize on my phone and spouting my attempt to everyone I talk to has been helpful in keeping me motivated.
I still plan to reinforce my memory and reading ability of Kanji by constructing an Anki deck of kanji sentences. I have only managed to put together a couple sentences so far but I did find a great social site for language learning named lang-8. It is a Facebook like social site that focuses on sharing journal entries written in the language you are trying to learn with native speakers. You then contribute by correcting posts in your native language and in return native speakers correct your entries. I have only managed to make a single entry but it seems like a great community.
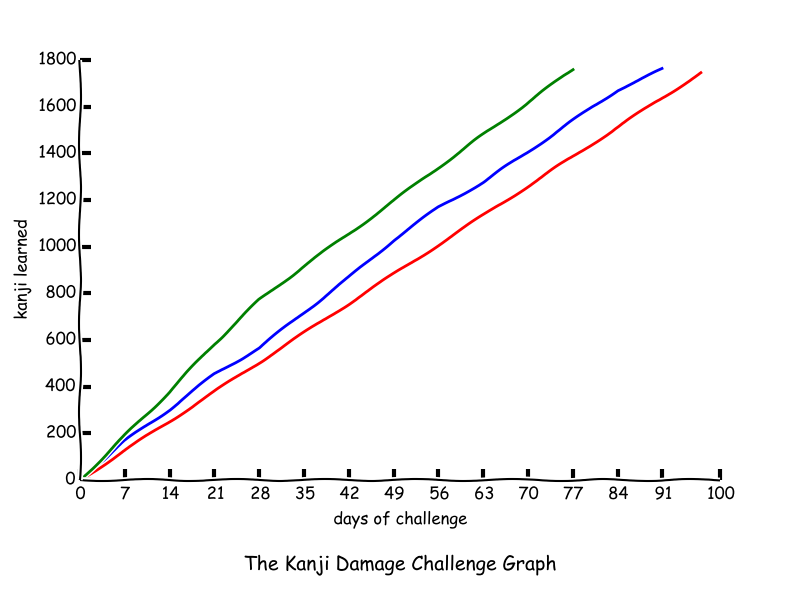
Progress Graph
What is not to like about charting my kanji progress as a graph? Nothing! So I rolled this python script to do just that!
import matplotlib.pyplot as plt
import numpy as np

with plt.xkcd():

    fig = plt.figure()
    ax = fig.add_axes((0.1, 0.2, 0.8, 0.7))
    ax.spines['right'].set_color('none')
    ax.spines['top'].set_color('none')
    ax.yaxis.set_ticks_position('left')
    ax.xaxis.set_ticks_position('bottom')

    xticks = np.array(range(0,97,7) + [100])
    plt.xticks(xticks)
    ax.set_ylim([0, 1800])

    xaxis = [0,7,14]
    yaxis = [0,167,303]
    plt.axis([0,100,0,1800])

    plt.plot(xaxis, yaxis)

    plt.plot(range(100),range(0,1700,17))

    plt.xlabel('days of challenge')
    plt.ylabel('kanji learned')
    fig.text(
        0.5, 0.05,
        'The Kanji Damage Challenge Graph',
        ha='center')

plt.savefig("images/kabnjidamagestatus.png")
The result is shown below!
I also added it to the sidebar and a new challenge section to give it a more prominent position.